This year has already started for a while and as always, we make a benchmark analysis of all campaigns running through us every quarter. This report is from January 1 to March 31, 2019. Different formats fall within Rich Media, each with different objectives. It is therefore advisable to choose the right formats that match the target group and campaign objectives. To facilitate this choice, we have made a benchmark analysis of several Rich Media formats. We have more than 100 formats in our portfolio, but in this report, we have selected the ten most used formats (read: data overkill).
We will explain the benchmarks based on four indicators: CTR, Engagement Rate, Interaction Rate and viewability. CTR is the click-through rate, Engagement rate is based on all user-intended interactions (clicks, buttons, expands, video controls), Interaction rate is a combination of Engagement and Mouseover (dwells). Finally, viewability is included according to MRC standards (1 sec active view, min. 50%). Of course, the objectives are different for each advertiser (branding, reach, leads, sales) and these figures do not take this into account.
Type of Rich Media CTR Engagement Rate User Interaction Rate Visibility.
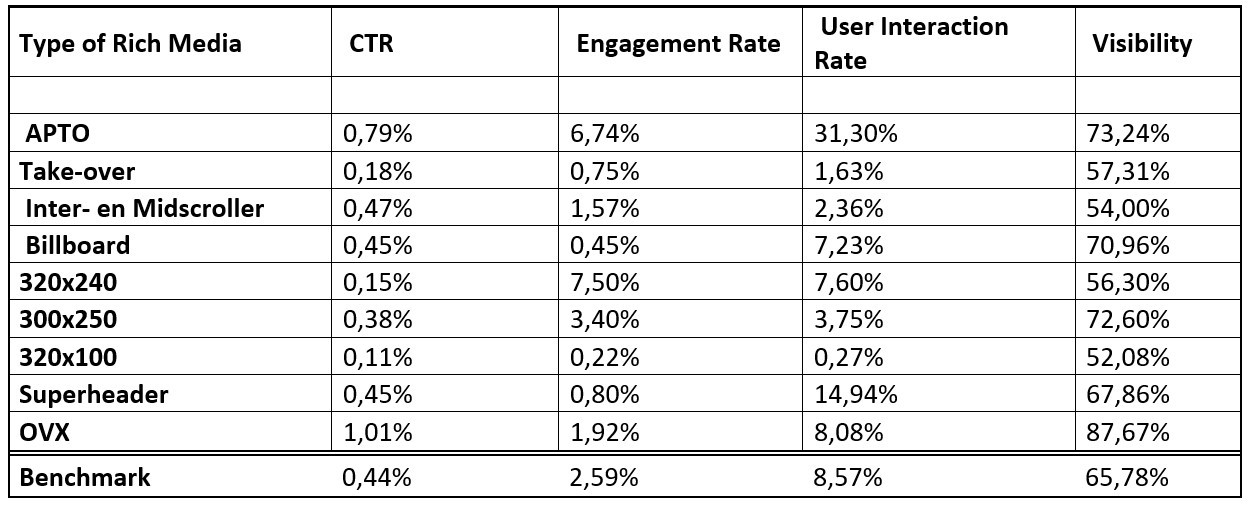
APTO
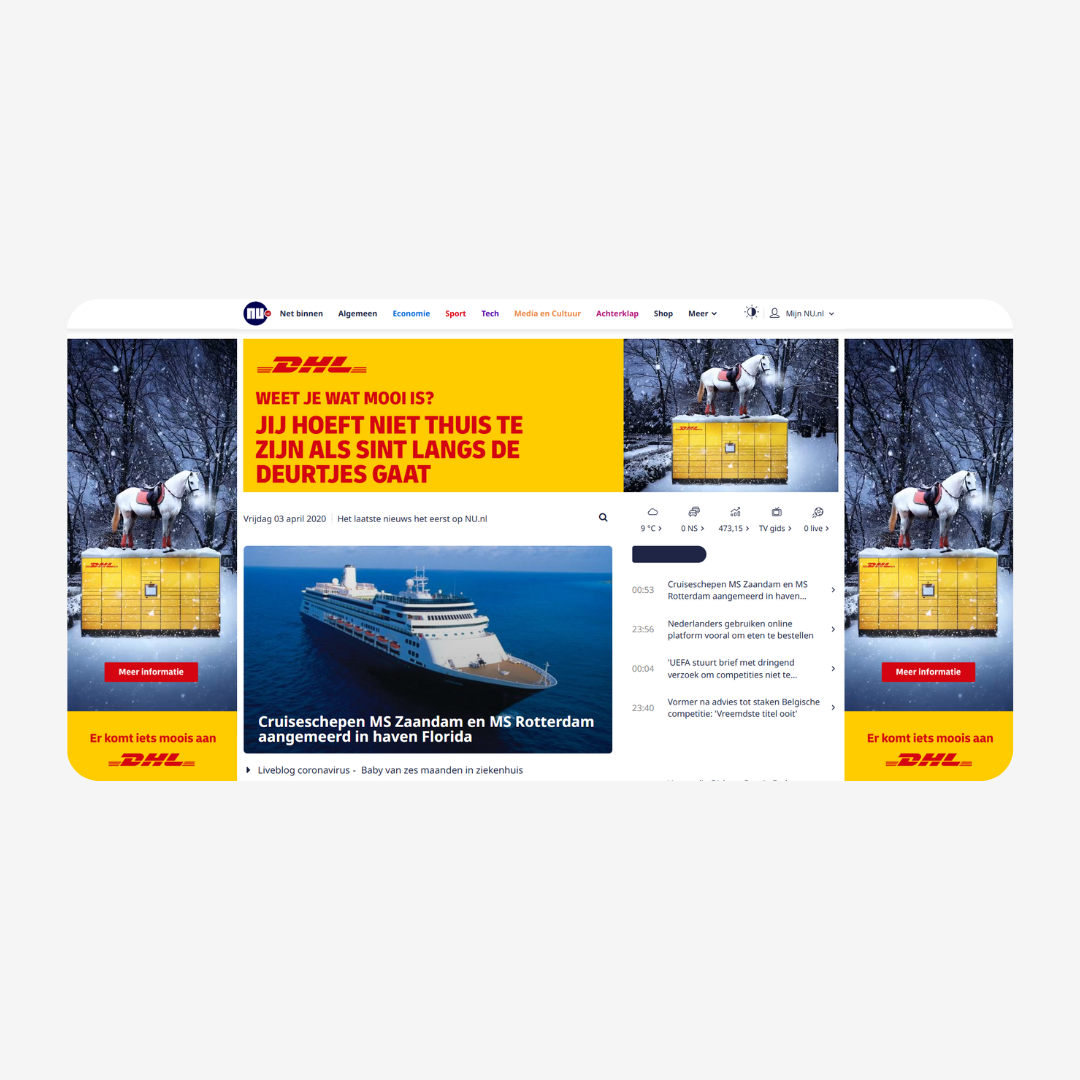
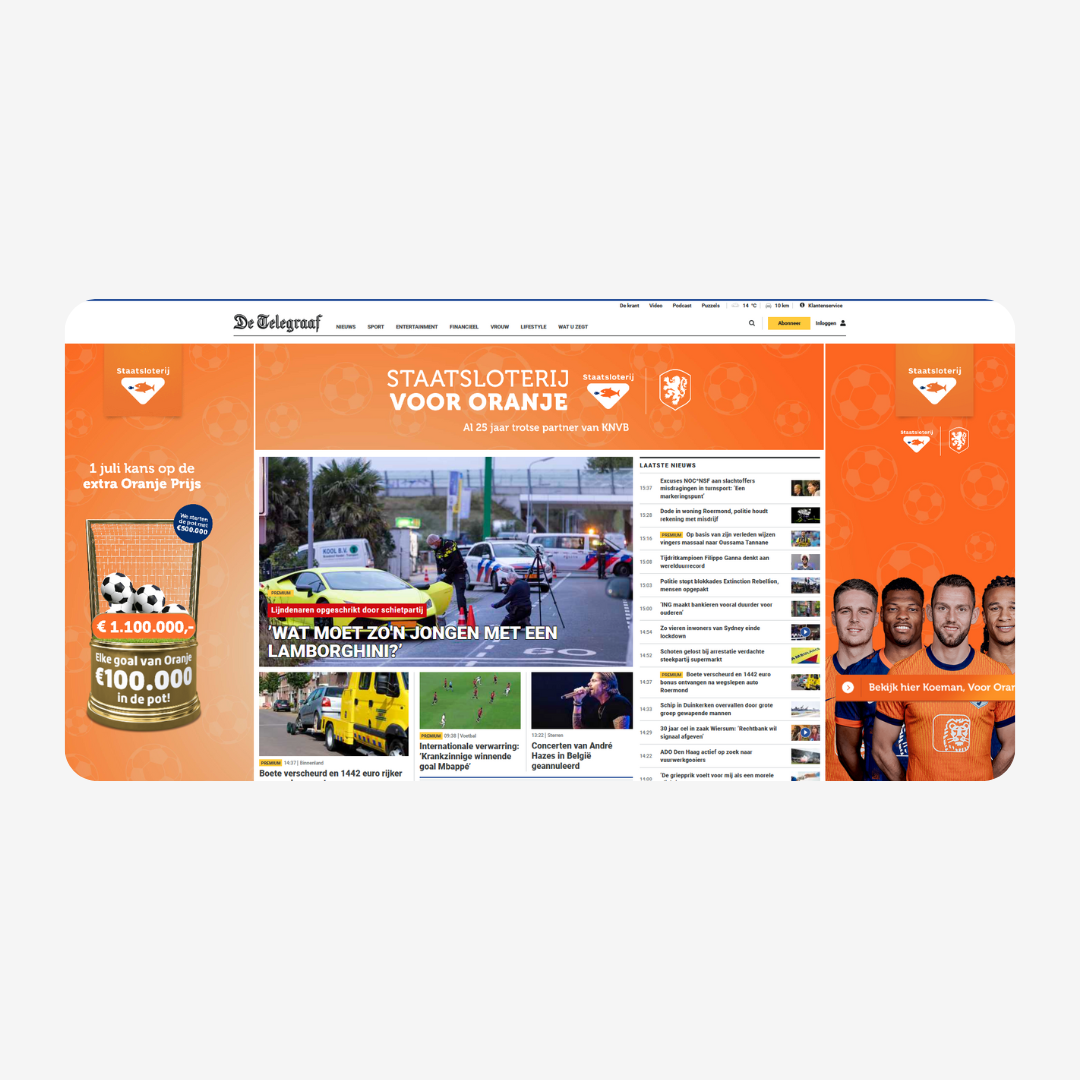
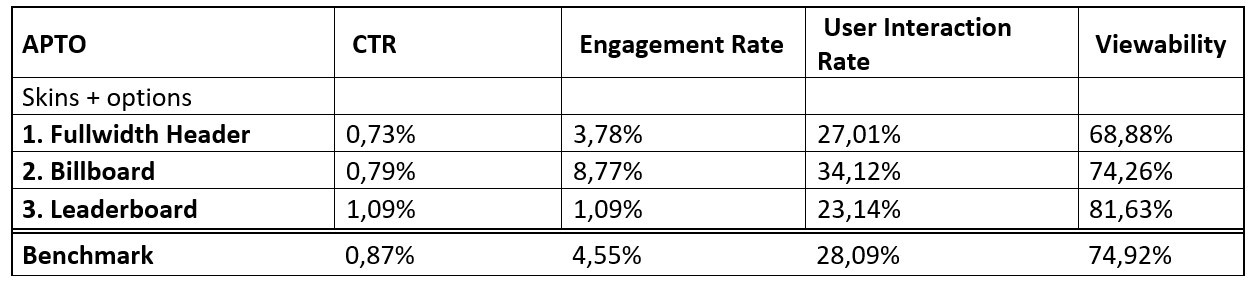
The Automated Page Take Over (APTO) is the format that we encounter most often and that is not surprising, because it produces good results. Just like the previous analysis, this format is again the best in the test and is therefore very stable in terms of results. The APTO consists of skins in combination with a Fullwidth Header, Billboard or a Leaderboard. The APTO skins are responsive and can therefore run on almost any website. The User Interaction Rate (31.30%) is very high with the APTO. This is because there are countless possibilities such as use of video, on-click elements, interactions and audio.
The three options that make up an APTO are also broken down. As you can see, the results are different per metric. For example, the Leaderboard has the highest CTA (1.09%). But if you are looking for a format with a high commitment, the billboard is the best option. That is why it is important to first look at the KPI’s of the relevant campaigns and then select the correct formats.
Often, take-overs are also used specifically made for a website and therefore have different specifications. These are included in the report, but are distorted, because they often run on one website and therefore have fewer views than an APTO that is run RTB.
The Mid and Interscroller are becoming increasingly popular. These formats scores above the metric CTR benchmark and has an excellent Engagement Rate (1.57%). The same applies to the Billboard. This format scores high on Visibility and is a good choice if you want to interact with your target group.
Various formats fall within the adslot (320x240): Parallax, MTO (Mobile Take-over), Swipe cubes, mobile half-page and deck of cards. These run both Mweb and In-app. This category has the highest Engagement Rate (7.5%).
Many mobile expressions are also used on the 300x250 adslot. These include the swipe cubes, but also frame scrollers, scratch banners, and rectangles. Expands and video are often implemented in this format, resulting in high visibility.
The 320x100 is a format that is exclusively an ad slot on mobile. This is somewhat lower in results. This is because many websites cannot run this format on their website and are therefore used much less.
The results of the Superheader have skyrocketed compared to the previous report. The Interaction Rate has even doubled, from 6.93% to 14.94%. Because this format is displayed on the full width of the screen, it is very useful for multiple videos and CTA’s.
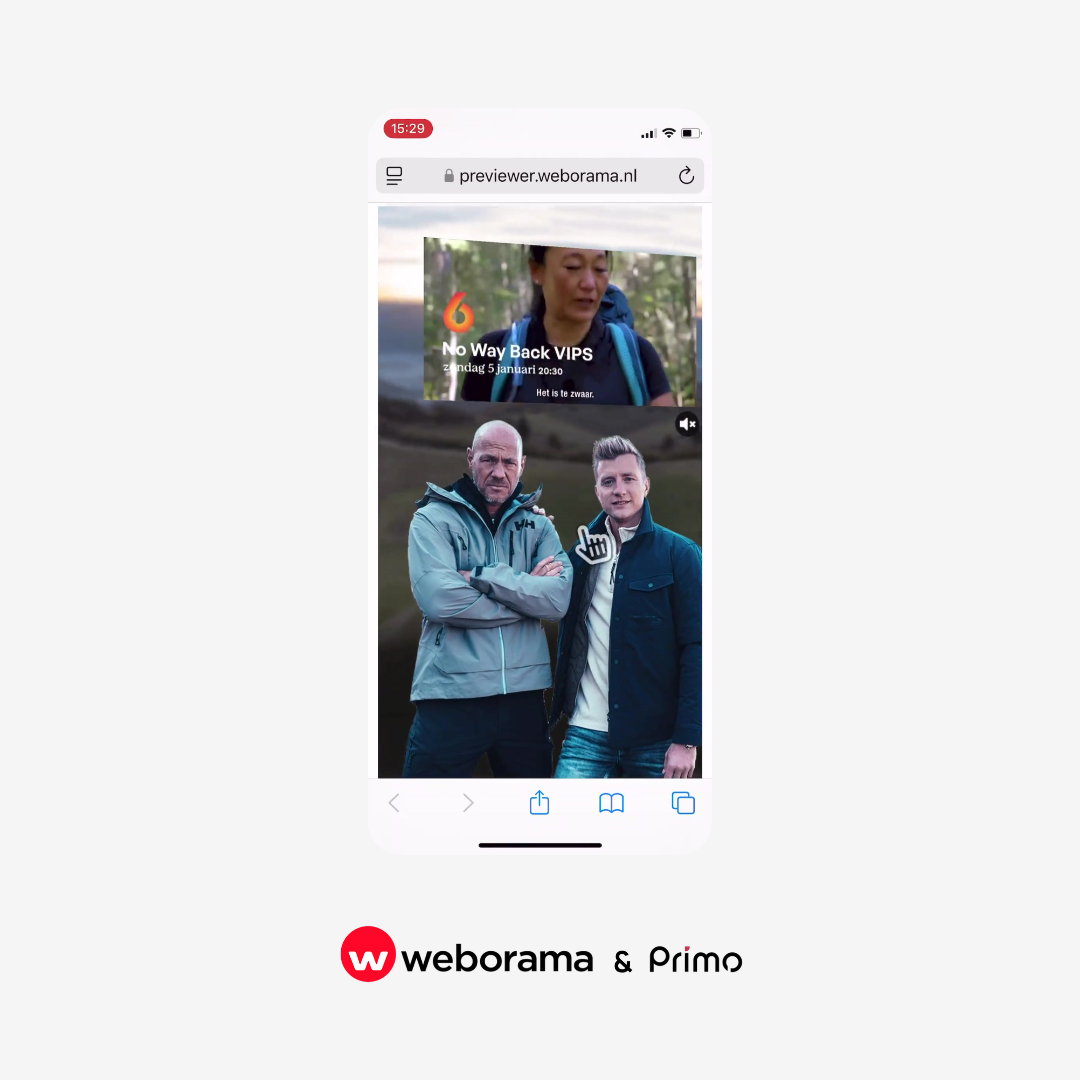
Finally, the Outstream Video Experience (OVX). Just like the previous benchmark report, it again scores high on CTR. This format consists of a video + reminder. We have also added two new video formats to our portfolio. These are the Mobile Portrait and the Native Outstream. These are so brand new that they have not yet been included in the report.
The results that emerged from the report are very positive and are relatively high compared to the market. We see many well-known formats coming back, but also more and more new expressions that are being tried out by the early adopters in the market. We like!
If you want to know more about these formats and where they can be used, look for inspiration in our showcase or contact us and we will be happy to visit you together. If you are in Amsterdam, then come and score a coffee if you are in the area of Keizersgracht 256.